Build a Stock Screener with Python (Part 2): Adding Catalyst Data

We will walk through how to pull biotech catalyst data (using Python and BPIQ) into a stock screener with other fundamental data about specific tickers you are interested in.
If you're interested in biotech investing and coding - let's go!
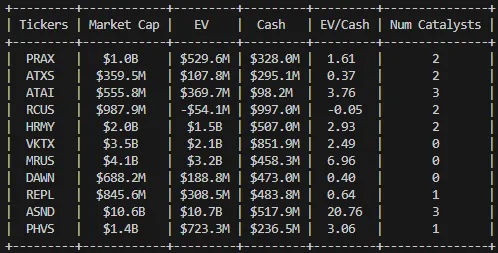
Here is the final screener:
+---------+------------+---------+---------+---------+---------------+
| Tickers | Market Cap |   EV    |  Cash   | EV/Cash | Num Catalysts |
+---------+------------+---------+---------+---------+---------------+
|  PRAX   |   $1.0B    | $529.6M | $328.0M |  1.61   |       2       |
|  ATXS   |  $359.5M   | $107.8M | $295.1M |  0.37   |       2       |
|  ATAI   |  $555.8M   | $369.7M | $98.2M  |  3.76   |       3       |
|  RCUS   |  $987.9M   | -$54.1M | $997.0M |  -0.05  |       2       |
|  HRMY   |   $2.0B    |  $1.5B  | $507.0M |  2.93   |       2       |
|  VKTX   |   $3.5B    |  $2.1B  | $851.9M |  2.49   |       0       |
|  MRUS   |   $4.1B    |  $3.2B  | $458.3M |  6.96   |       0       |
|  DAWN   |  $688.2M   | $188.8M | $473.0M |  0.40   |       0       |
|  REPL   |  $845.6M   | $308.5M | $483.8M |  0.64   |       1       |
|  ASND   |   $10.6B   | $10.7B  | $517.9M |  20.76  |       3       |
|  PHVS   |   $1.4B    | $723.3M | $236.5M |  3.06   |       1       |
+---------+------------+---------+---------+---------+---------------+
In Part 1 we walked through how to create a basic screener in python in ~10 minutes. We will use that as our starting base and build upon that. You can find the starting code in this GitHub repo.
In Part 2 (this one), we will pull biotech catalysts and merge them into our output table screener that we built in Part 1. In this example we will display how many catalysts each ticker has in the next 90 days.
You can see the final code for this Part 2 on GitHub here.
Before we begin remember to create/activate your virtual environment and install any packages from Part 1. If you are pulling the code for Part 1 from GitHub, you can install the python packages from Part 1 by running:
>>> pip install -r requirements.txt
We are going to make 2 upgrades:
- Add a new function get_catalyst_data that will accept a ticker and call the BPIQ API to fetch the catalysts.
- Update our main function to call the new get_catalyst_data function and handle adding that to our table output.
Add New Function get_catalyst_data
Before we create the new function we need to install a few additional packages and update our imports at the top of our script.
Start by installing requests, which we will use to call the BPIQ API:
>>> pip install requests
Now let's update the imports at the top of our script to include requests. We will also import a standard (built-in) python library called datetime.
from datetime import date, timedelta # NEW
import requests # NEW
import yfinance as yf
from tabulate import tabulate
We have the previous imports of yfinance and tabulate, but added datetime and requests.
Next create the function get_catalyst_data that:
- Accepts a parameter ticker.
- Sets how far ahead we want to limit catalyst dates.
- Calls the BPIQ API and handles the API response.
- Returns either a dash string or the number of catalysts in that date range.
def get_catalyst_data(ticker):
    today = date.today()
    months_to_add = 3
    future_date = today + timedelta(days=months_to_add*30)

    # call to bpiq api
    url = f'https://api.bpiq.com/api/v1/drugs/?ticker={ticker}&catalyst_date_max={future_date}'
    headers = {
        'Authorization': f'Token {credentials.BPIQ_API_KEY}'
    }

    response = requests.get(url, headers=headers)

    if response.status_code == 200:
        data = response.json()
    else:
        print(f"Request failed with status code {response.status_code}")
        return "-"

    return data.get("count", "-")

        # return the drug/catalyst data
You might have noticed we have "{credentials.BPIQ_API_KEY}". To make the call to the BPIQ API we need an API Key. You can get a free trial API Key from BPIQ. Once you get your key you can replace the code "{credentials.BPIQ_API_KEY}" with your API key "YOUR-API-KEY".
If you want to follow using the "{credentials.BPIQ_API_KEY}" method then:
- Create a new file "credentials.py" and put your API Key in it like so:
BPIQ_API_KEY = "YOUR-API-KEY"
- Import credentials at the top of your main python script.
from datetime import date, timedelta
import credentials # <== NEW

import requests
import yfinance as yf
from tabulate import tabulate
And with that we are finished with our function to get catalysts!
Now let's update our main function to call our new function and handle the output
You can see below we add 2 new lines of code and update 2 previous lines of code.
def main():
    with open("tickers.txt") as f:
        tickers = [line.strip().upper() for line in f if line.strip()]

    results = []
    for ticker in tickers:
        data = get_stock_data(ticker)
        catalyst_data = get_catalyst_data(ticker) # <== NEW
        results.append([
            data["Ticker"],
            format_number(data["Market Cap"]),
            format_number(data["EV"]),
            format_number(data["Cash"]),
            f"{data['EV/Cash']:.2f}" if data["EV/Cash"] else "-", # <== UPDATED
            catalyst_data # <== NEW
        ])

    headers = ["Tickers", "Market Cap", "EV", "Cash", "EV/Cash", "Num Catalysts"] # <== UPDATED
    print(tabulate(results, headers=headers, tablefmt="pretty"))
Now let's run our script and see our Updated Screener:
>>> python script.py
... It may run for a few seconds but be patient... 🎉
You can use this to check EV/Cash against how many near-term catalysts companies have, or modify the data to find different opportunities!
Want to pull this data into Excel? Check out Part 3 and do just that!